
Knowledge Center
Analysis methods
Which instrument and method a test is performed with is a separate entry point. The method page links to all the test and conformity pages where that method is used.
Chromatography
Components in a mixture are carried at different rates by a mobile phase through a stationary phase. The separated components leave the column at different times; the exit time identifies the component and the area of the signal gives its quantity.
8 methods
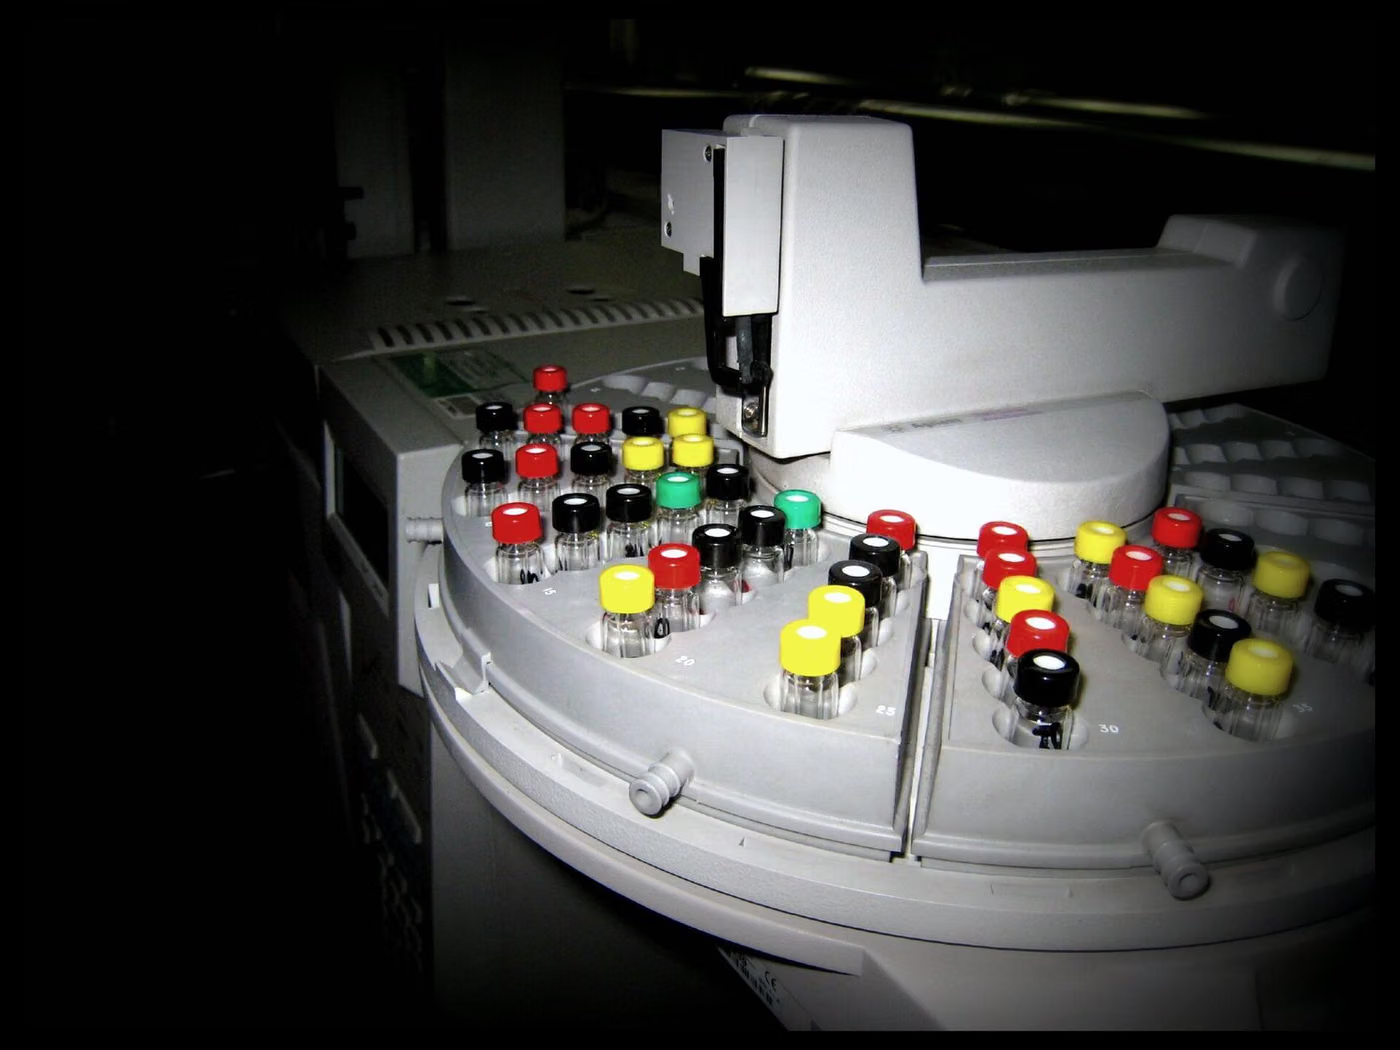 GC AnaliziGas ChromatographySeparates and determines volatile and semi-volatile components that can be vaporised.Question it answers: Which volatile components are in this mixture, and how much?Sample: Liquid or gas; for solid samples, after extraction.Limitation: Heat-sensitive or non-volatile compounds cannot be analysed directly.
 GC-MS AnalysisGas Chromatography – Mass SpectrometryIdentifies separated volatile components by their mass spectra and gives their quantity.Question it answers: What is this unknown volatile component? Can it be identified by library comparison?Sample: Liquid extract, gas or headspace sample.Limitation: Separating isomers is not always possible; chromatographic separation is required.
- GC-MS/MS AnalysisGas Chromatography – Tandem Mass SpectrometryDetermines targeted volatile compounds selectively in complex matrices.Question it answers: Is the target compound really present at trace level in a difficult matrix?Sample: Cleaned-up extract; usually after QuEChERS or SPE.Limitation: It is a targeted method; a compound not on the list is not looked for.
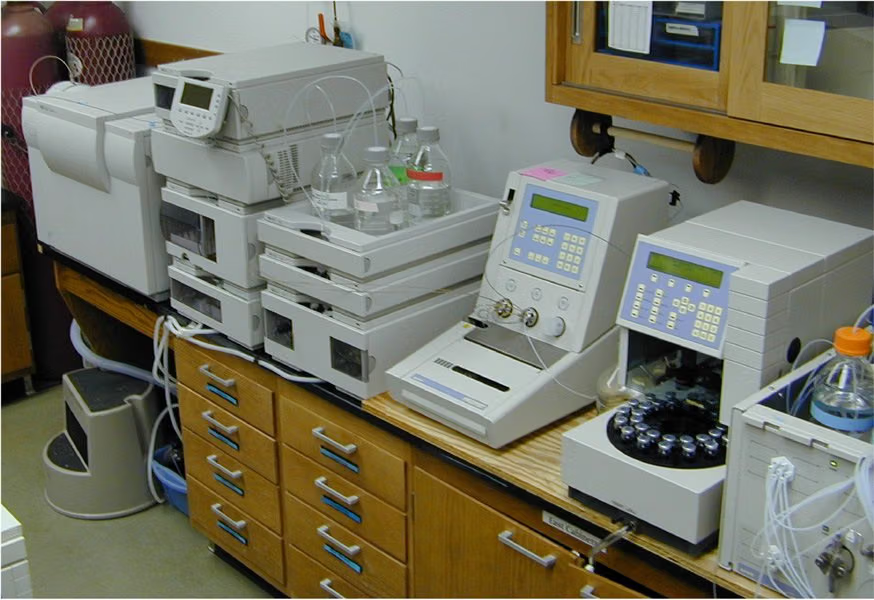 HPLC AnalysisHigh Performance Liquid ChromatographySeparates and determines non-volatile and heat-sensitive components in the liquid phase.Question it answers: How much active substance, additive or impurity is in this product?Sample: A dissolved and filtered liquid sample.Limitation: It depends on the detector: compounds with no UV absorption require a different detector.
- LC-MS AnalysisLiquid Chromatography – Mass SpectrometryIdentifies components separated in the liquid phase by their masses.Question it answers: What is this component and can it be confirmed?Sample: A filtered liquid extract.Limitation: Matrix effects can suppress ionisation; an internal standard is required.
- LC-MS/MS AnalysisLiquid Chromatography – Tandem Mass SpectrometryMeasures target compounds at trace level in complex matrices with high selectivity.Question it answers: Is the residue, contaminant or impurity below the regulatory limit?Sample: A cleaned-up and concentrated extract.Limitation: It works on a targeted basis; screening requires separate high-resolution methods.
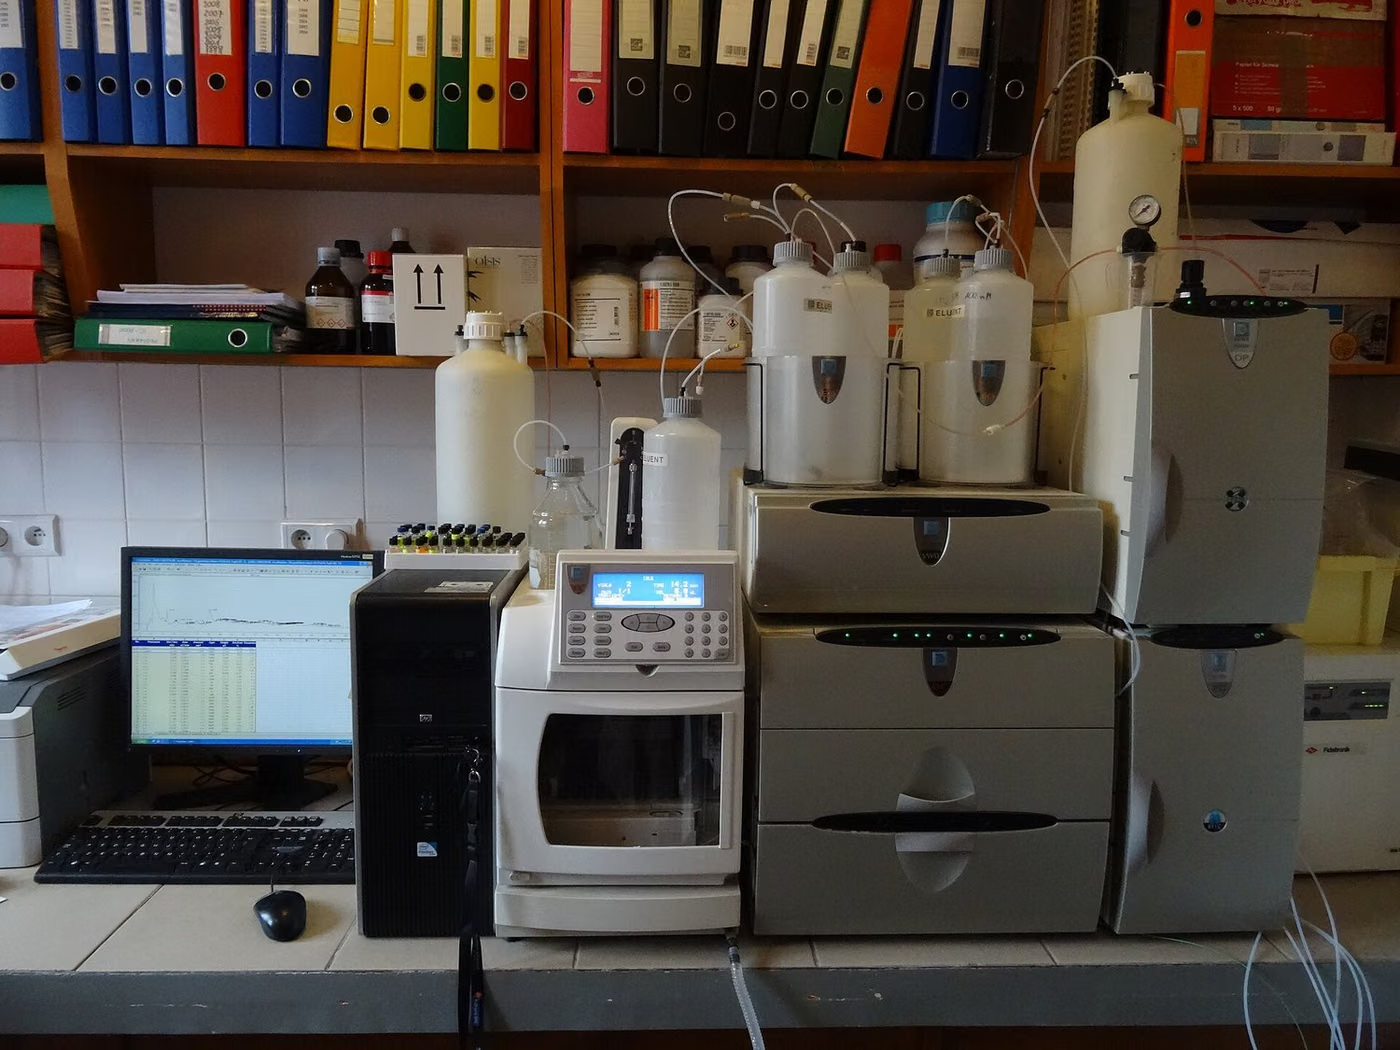 IC AnalysisIon ChromatographySeparates and determines anions and cations in aqueous solutions.Question it answers: What is the chloride, sulphate, nitrate or fluoride concentration in the water?Sample: A filtered aqueous sample or aqueous extract.Limitation: Non-ionic components are not seen by this method.
- GPC AnalysisGel Permeation ChromatographyDetermines the molecular weight distribution of polymers.Question it answers: Is the polymer chain of the expected length, or was it broken during processing?Sample: A polymer fully dissolved in a suitable solvent.Limitation: The result is relative to the calibration standard; it gives relative rather than absolute molecular weight.
Spectroscopy and elemental analysis
The interaction of matter with light (or plasma) is measured. The wavelength of the energy absorbed, emitted or scattered identifies the substance; its intensity gives the quantity.
12 methods
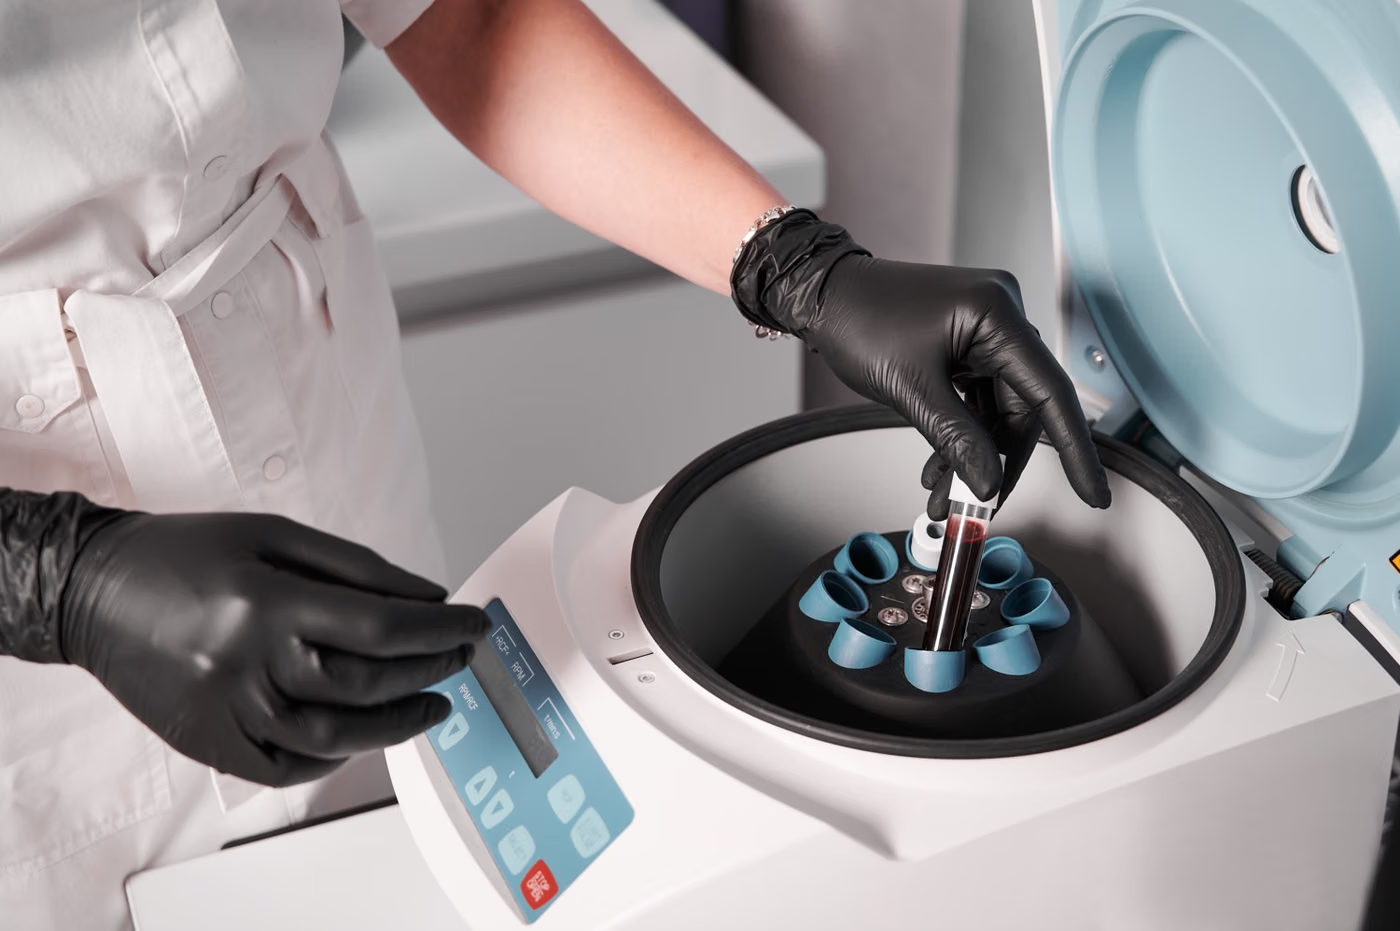 ICP-MS AnalysisInductively Coupled Plasma – Mass SpectrometryMeasures elements at very low concentrations, simultaneously and selectively.Question it answers: Are there heavy metals or trace elements in this sample, and how much?Sample: A sample taken into solution by acid digestion.Limitation: It does not say in which chemical form the element is present; for speciation it is combined with chromatography.
- ICP-OES AnalysisInductively Coupled Plasma – Optical Emission SpectrometryMeasures elements simultaneously in the medium and high concentration range.Question it answers: Is the alloy composition or mineral content within the expected range?Sample: A sample dissolved by acid digestion.Limitation: It is not as sensitive as ICP-MS at trace level.
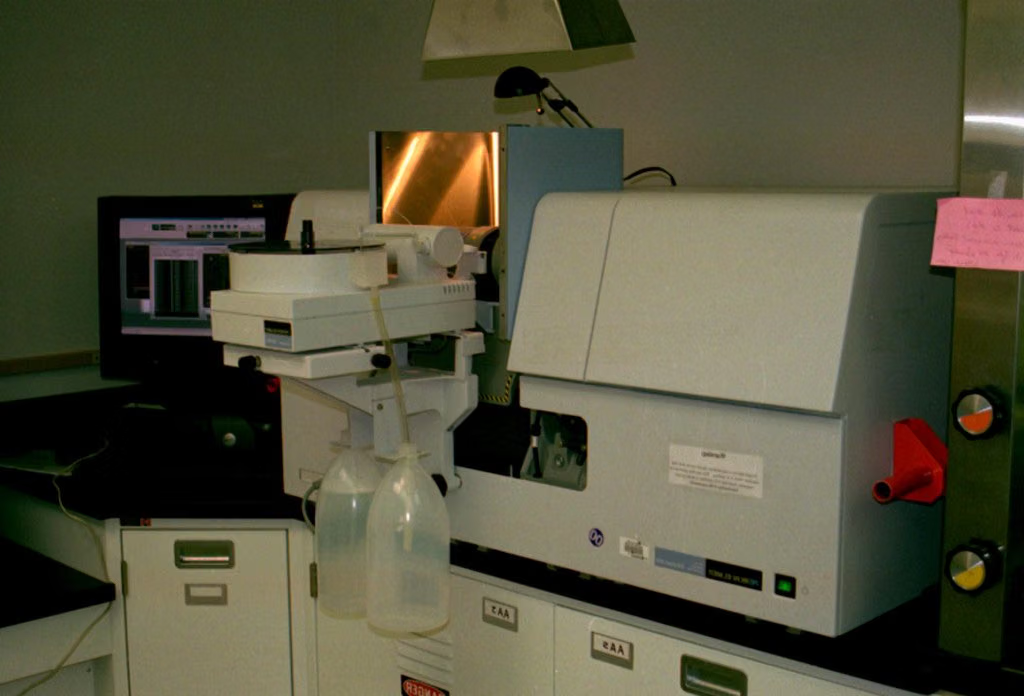 AAS AnalysisAtomic Absorption SpectrometryMeasures a single element with high selectivity.Question it answers: How much lead (or a single target element) is in this sample?Sample: A sample taken into solution.Limitation: It works on a single element; for a multi-element panel, ICP is preferred.
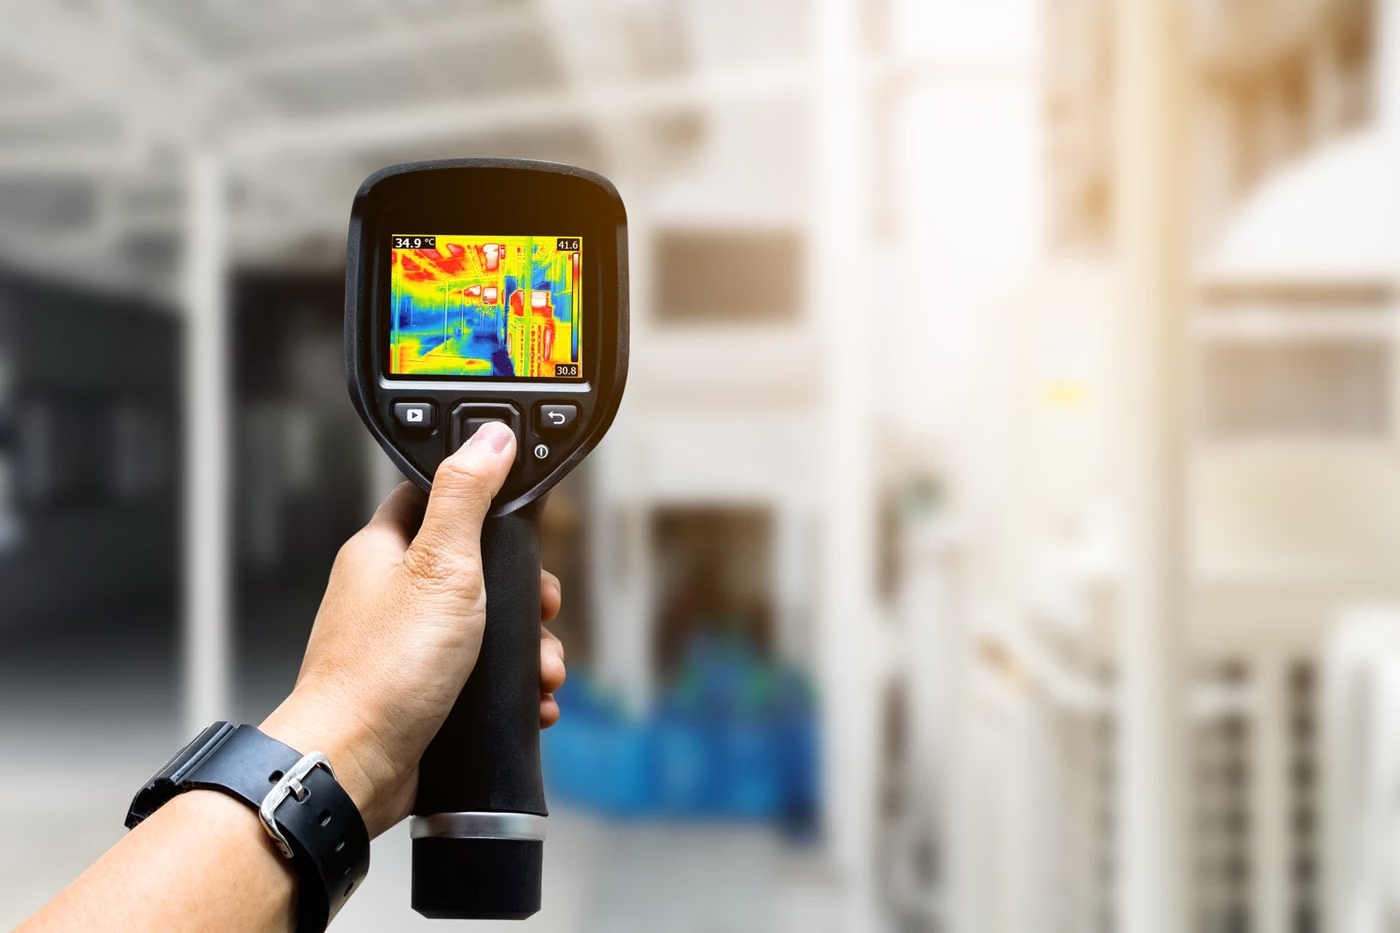 XRF AnaliziX-Ray Fluorescence SpectrometryMeasures elemental composition and coating thickness non-destructively.Question it answers: Which alloy is this part? What is the coating thickness?Sample: A solid sample; it can be measured without preparation.Limitation: It cannot reliably measure light elements such as carbon, nitrogen and oxygen.
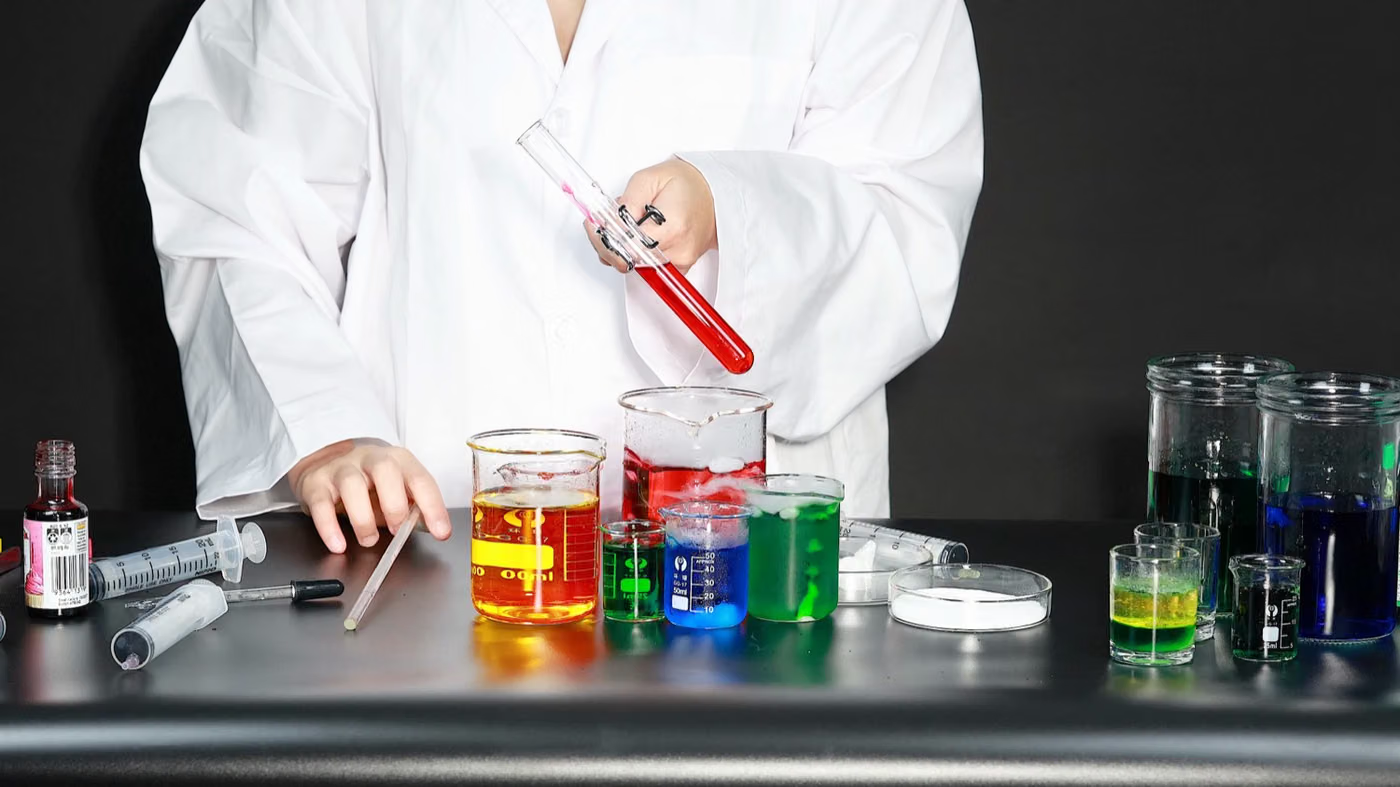 OES AnaliziOptical Emission Spectrometry (spark)Determines the full composition of metals, including carbon, rapidly.Question it answers: What is the carbon content and alloy grade of this steel?Sample: A solid metal sample with a flat, clean surface.Limitation: It is applied only to conductive solid metals; the sample surface must be ground.
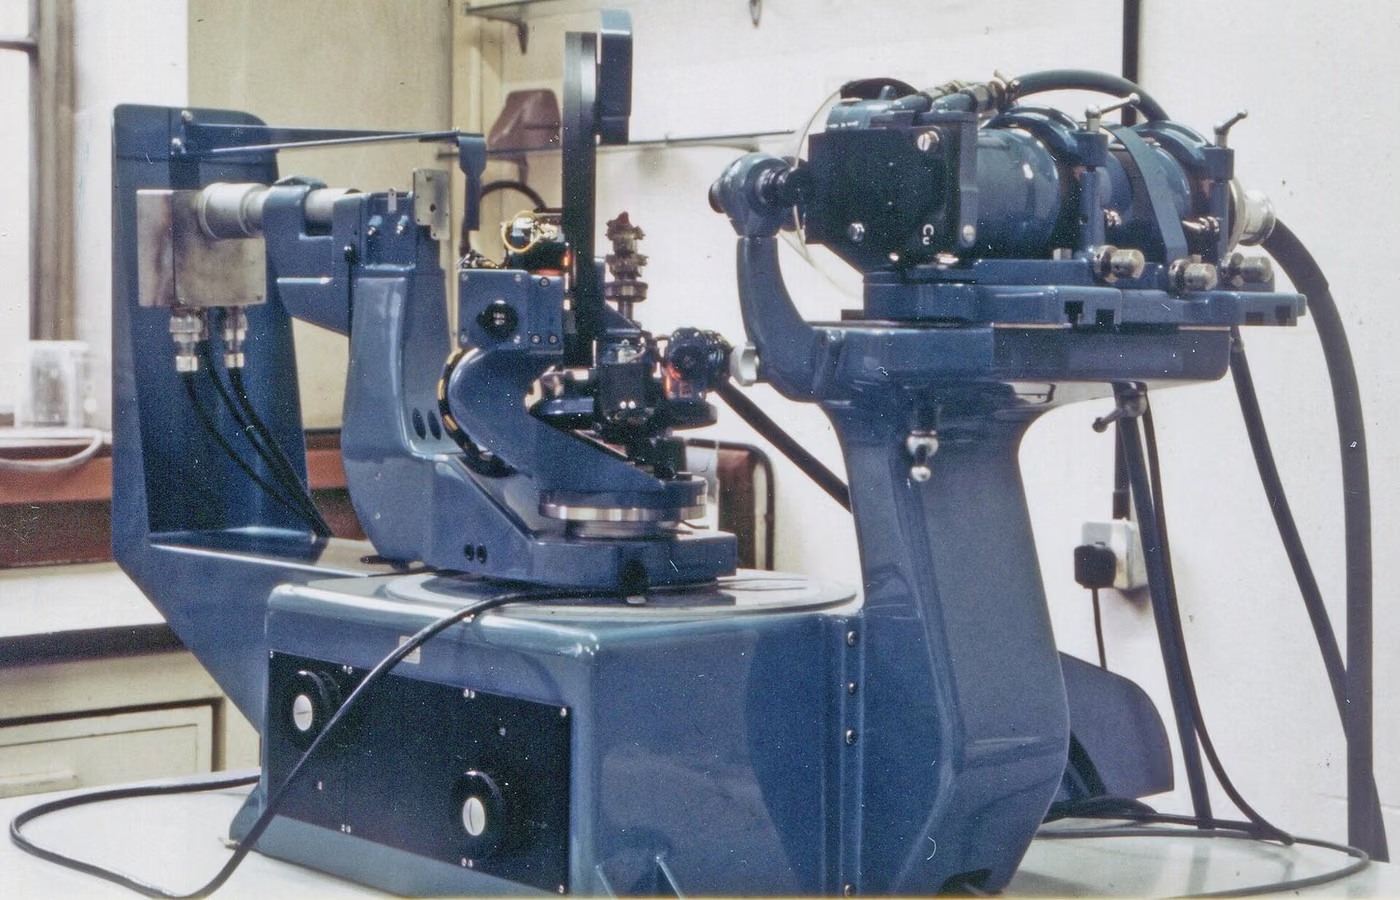 XRD AnalysisX-Ray DiffractionDetermines the crystal structure and phases.Question it answers: What is the crystalline phase of this powder? Which compound of the same element is it?Sample: A powder or a solid sample with a flat surface.Limitation: It gives no phase information for amorphous materials and does not measure elemental concentration.
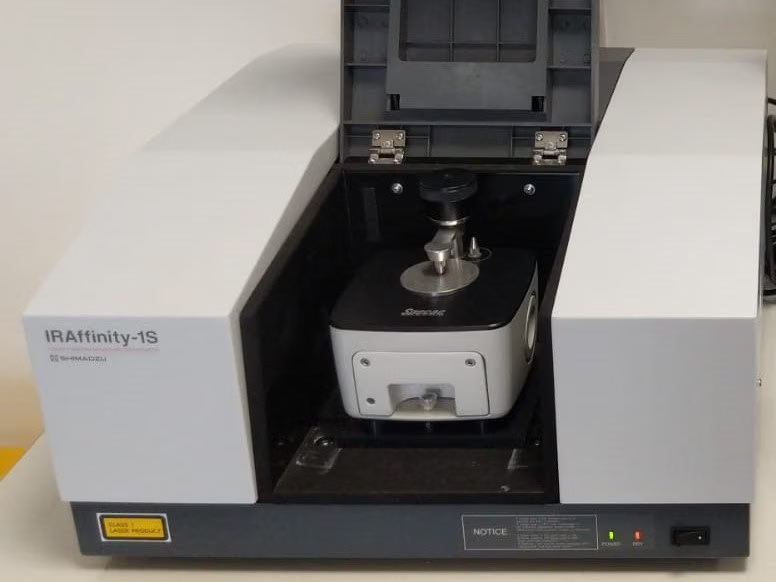 FTIR AnalysisFourier Transform Infrared SpectroscopyIdentifies a material by determining the functional groups in the molecule.Question it answers: Which polymer is this plastic? Is this raw material the declared substance?Sample: Solid, liquid or film; with ATR, preparation is usually not required.Limitation: Separating components in mixtures is limited; it is not suitable for trace levels.
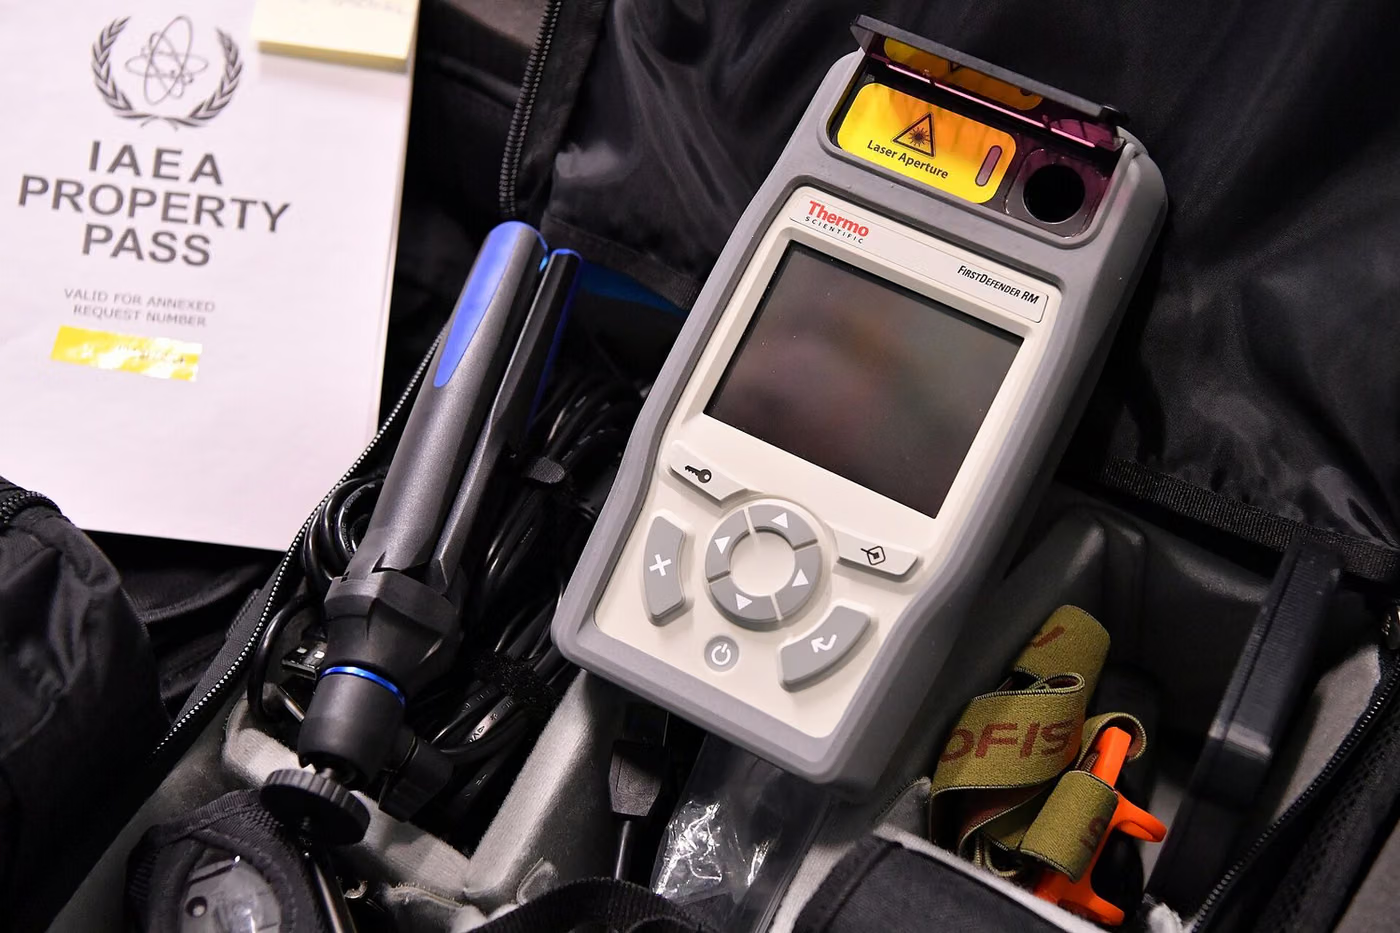 Raman AnalysisRaman SpectroscopyDetermines molecular vibrations through scattered light.Question it answers: What is this particle or coating? Can it be identified without opening the packaging?Sample: Solid or liquid; it can even be measured through transparent packaging.Limitation: The signal can be suppressed in samples that fluoresce.
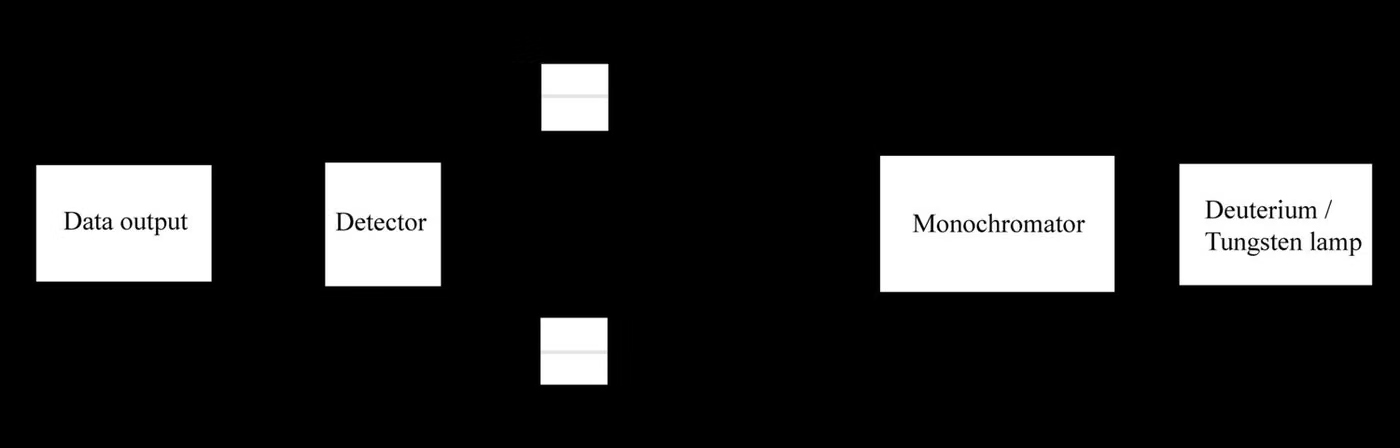 UV-VIS AnalysisUltraviolet–Visible SpectrophotometryMeasures the concentration of coloured or UV-absorbing components in solution.Question it answers: What is the concentration of the target component in this solution?Sample: A clear solution.Limitation: Its selectivity is low; components with similar absorption are not separated.
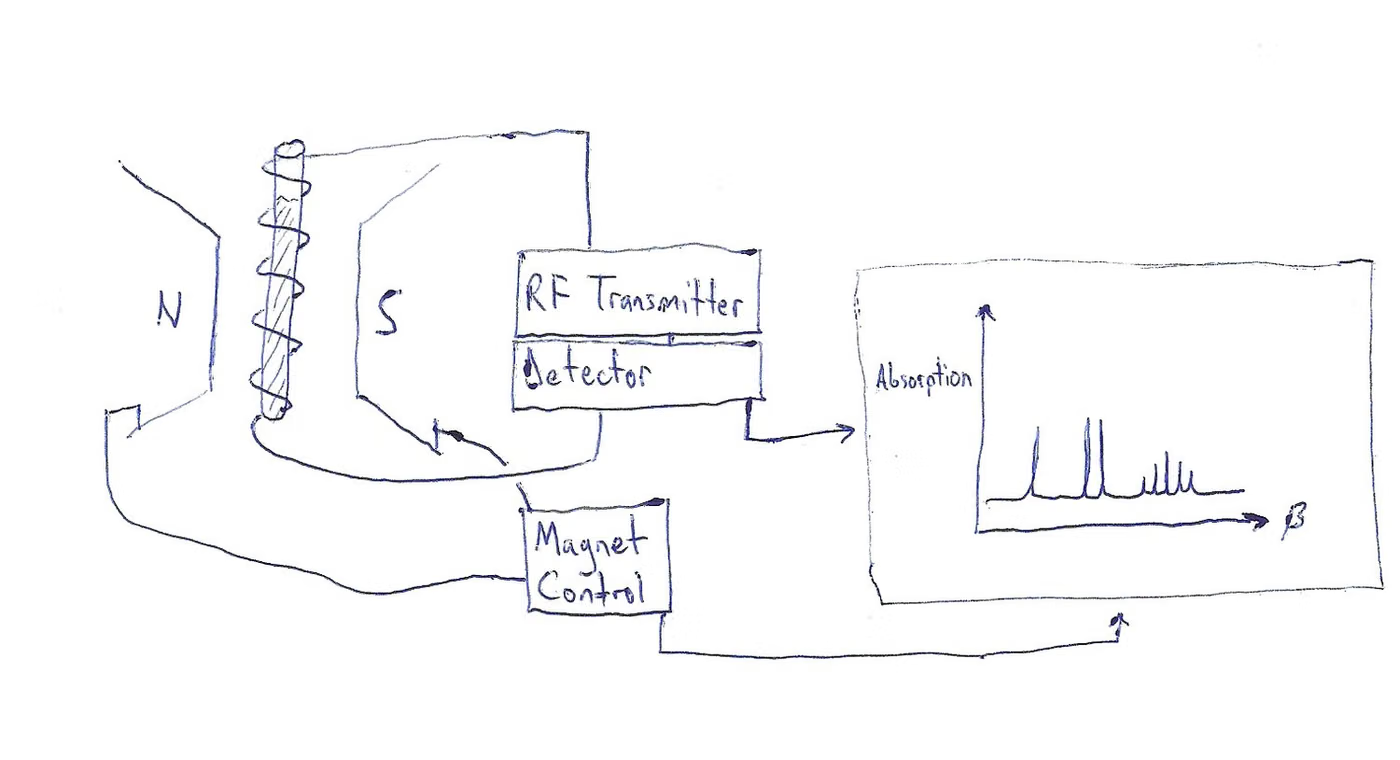 NMR AnalysisNuclear Magnetic Resonance SpectroscopyDetermines the structure of a molecule at the level of atomic connectivity.Question it answers: What is the molecular structure of this unknown compound?Sample: A sample dissolved in a suitable deuterated solvent.Limitation: It requires a relatively large amount of sample; it is not suitable for trace analysis.
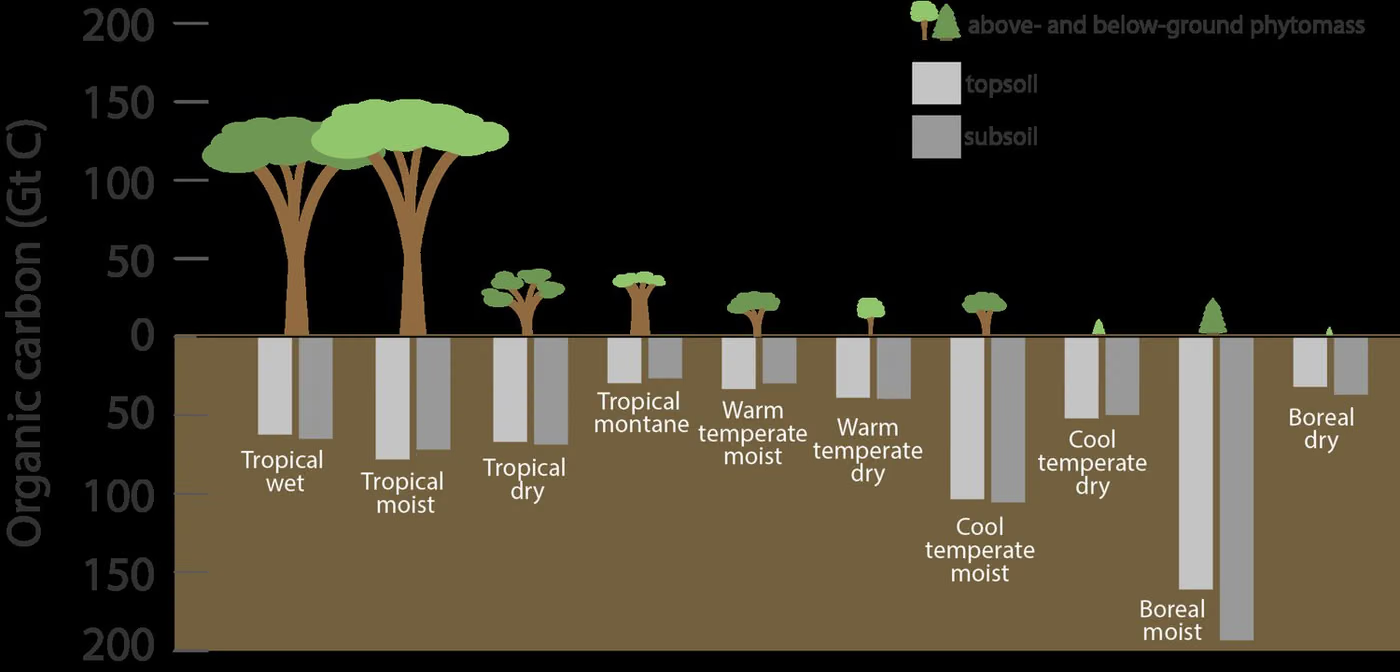 TOC AnaliziTotal Organic CarbonGives the total organic carbon content of a sample.Question it answers: How much organic residue does this water, or this surface after cleaning, carry?Sample: Water or aqueous extract.Limitation: It does not say which organic compound is present; it gives the total load.
 Karl Fischer AnalysisKarl Fischer TitrationMeasures the water content of a sample directly and selectively.Question it answers: Is this raw material ready for processing, and what is its moisture content?Sample: Solid or liquid; it must be delivered in a moisture-proof container.Limitation: It measures only water; other volatiles do not enter the result (which is an advantage).
Thermal analysis
The sample is heated or cooled under a controlled temperature programme; mass, heat flow or dimensional change is recorded as a function of temperature.
4 methods
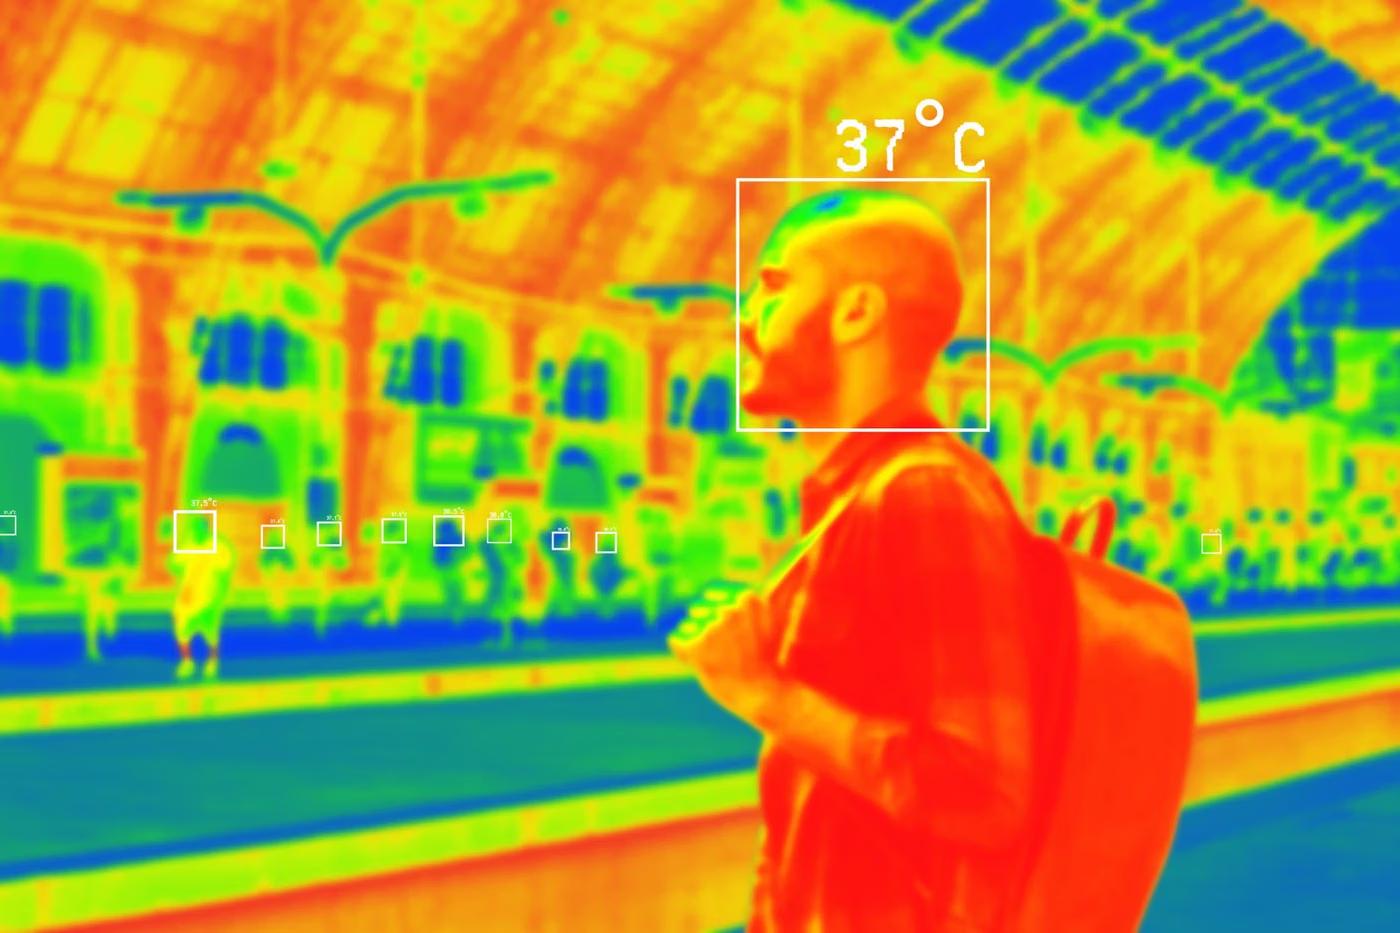 DSC AnaliziDifferential Scanning CalorimetryDetermines thermal events such as melting, glass transition, crystallisation and curing.Question it answers: What is the glass transition temperature of this polymer? Has the resin cured fully?Sample: A few milligrams of solid or liquid in a sealed pan.Limitation: It does not measure mass loss; TGA is required for the extent of decomposition.
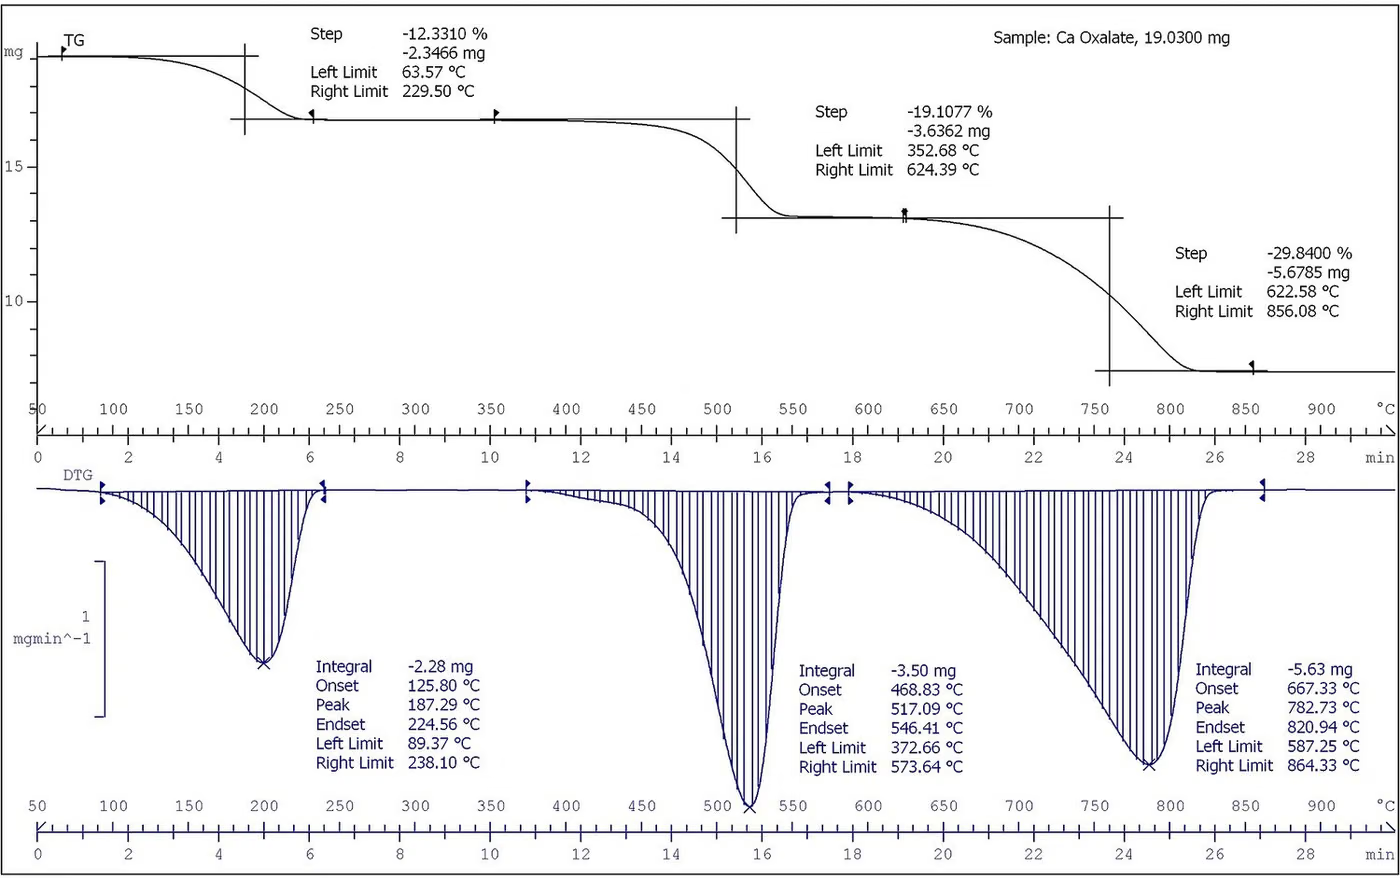 TGA AnaliziThermogravimetric AnalysisRecords the change in mass with temperature.Question it answers: What is the filler content of this compound? At what temperature does the material decompose?Sample: A few milligrams of solid sample.Limitation: It does not see events that produce no change in mass (such as glass transition).
- DMA AnaliziDynamic Mechanical AnalysisMeasures storage and loss modulus as a function of temperature and frequency.Question it answers: How rigid is this material at service temperature? What is its damping behaviour?Sample: A small bar or film of standard geometry.Limitation: The result depends on the frequency applied; it should not be reported as a single value.
- TMA AnalysisThermomechanical AnalysisMeasures dimensional change with temperature and the coefficient of thermal expansion.Question it answers: How much does this material expand when heated?Sample: A small solid sample with a smooth surface.Limitation: It measures under load; the specimen geometry directly affects the result.
Microscopy and imaging
The surface or internal structure of a sample is imaged with a beam of light or electrons. Because the wavelength in electron microscopes is far shorter, detail beyond the reach of a light microscope becomes visible.
3 methods
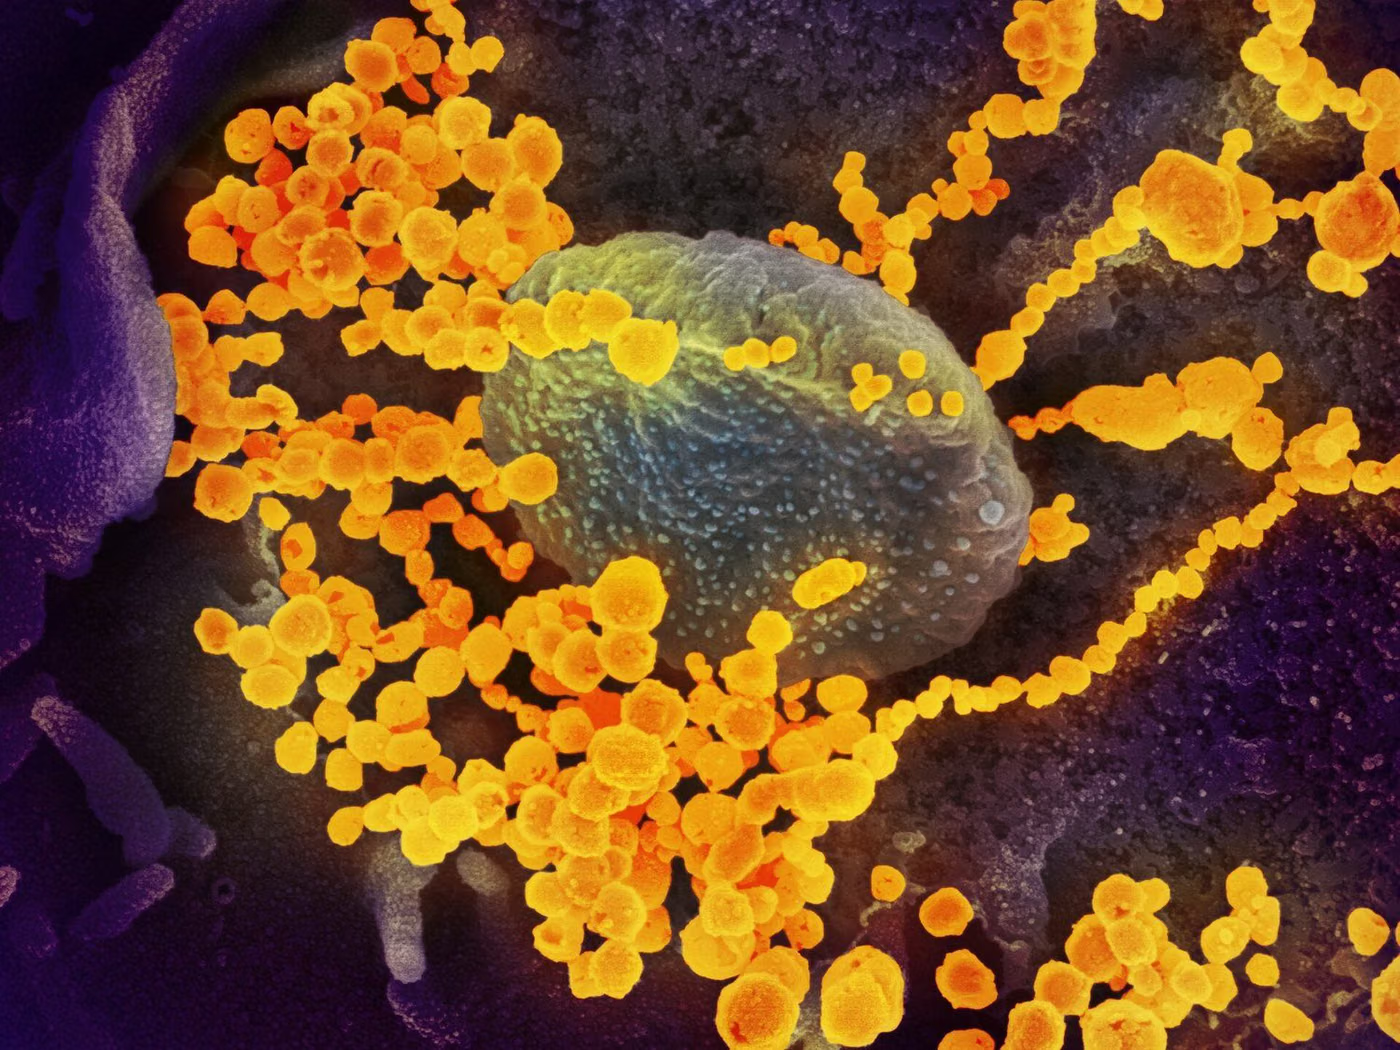 SEM AnalysisScanning Electron MicroscopeImages surface morphology at high magnification with a deep depth of field.Question it answers: How did this fracture surface form? Are there micro-cracks in the coating?Sample: A solid sample; non-conductive ones are given a thin coating.Limitation: It gives no elemental information; EDS is added for that.
- SEM-EDS AnalysisScanning Electron Microscope – Energy Dispersive SpectroscopyGives the elemental composition of the point examined together with the image.Question it answers: Which elements does this residue or contamination consist of?Sample: A solid sample; a coating is applied if conductivity is required.Limitation: It is semi-quantitative; its reliability is limited for light elements and at trace level.
 TEM AnalysisTransmission Electron MicroscopeImages the internal structure of a sample at close to atomic resolution.Question it answers: What is the nanostructure, the thin film layering or the crystal defects?Sample: A sample thinned until it is transparent to electrons.Limitation: Sample preparation is laborious and destructive; the volume examined is very small.
Each method page links to the test and conformity pages where that method is used. For example, XRF analysis is related to the metal composition, RoHS screening, heavy metal and coating thickness pages. Since the limit of detection/quantification (LOD/LOQ) and accuracy vary by matrix and sample preparation, no figure is given here; values within method validation are communicated at the quote stage.